Most students that struggle with maths find the abstract elements hardest. Think about how many students you’ve taught that dislike algebra because they don’t understand it.
In the 1960s, American psychologist Jerome Bruner put forward a theory that people learn in three stages: Enactive (the representation of knowledge through actions), Iconic (the visual summarization of images), and symbolic representation. In the 1980s, Singapore developed its bar model method based on Bruner's theory of learning, now commonly known as Concrete-Pictorial-Abstract.
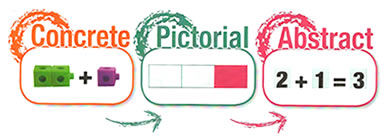
Algebra is not the only part of maths that’s abstract – the symbols for addition and subtraction are abstract the first time they are seen. Now think about the students that struggle with addition and subtraction… have you seen them drawing on number lines to help them? Or counting on their fingers? This helps the abstract move into the pictorial and the concrete.
Since first hearing the phrase from my second in department last year, I have often said to students, “If it’s tricky, draw a piccy!” (Click here for the poster!) Now this is well and good if it’s a shape problem the student is presented with as it will be seemingly obvious what to draw. However if the problem is based on ratio and proportion or algebra, the phrase above may confuse the student more rather than helping them.
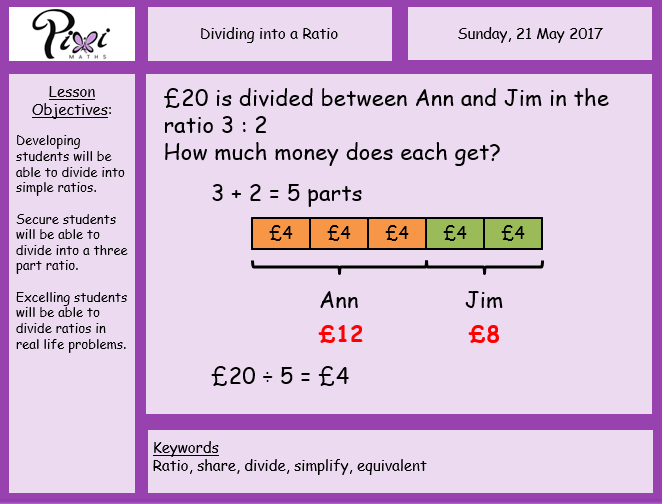
The Singapore bar model is now relatively widely used by maths teachers across the UK as it supports students in converting the abstract to the pictorial and helping them eventually solve the set problem. I have adopted it into my teaching in the last year, and the more I use it, the more I love it.
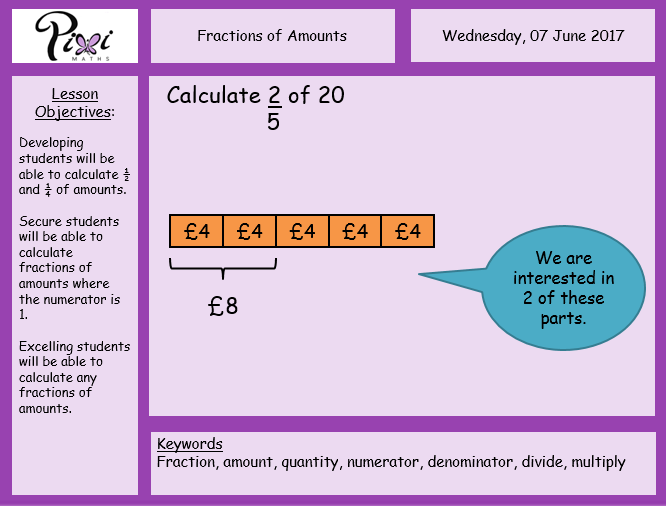
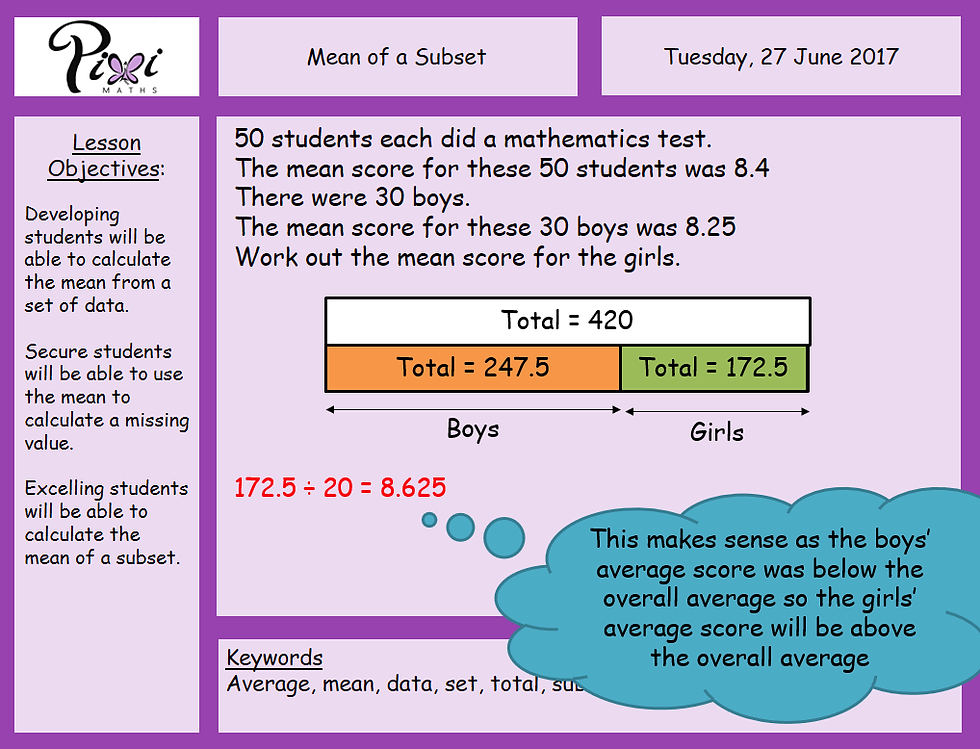
To begin with I used it to percentage increase and decrease. Then dividing into a ratio, fractions of amounts, reverse percentages. In my blog about #MathsConf10 I wrote about how I had learned how to expand the bar model into algebra – simple linear equations up to simultaneous equations. Now I use the bar model wherever I can, most recently with finding the mean of a subset! It really is an incredibly diverse part-whole tool.
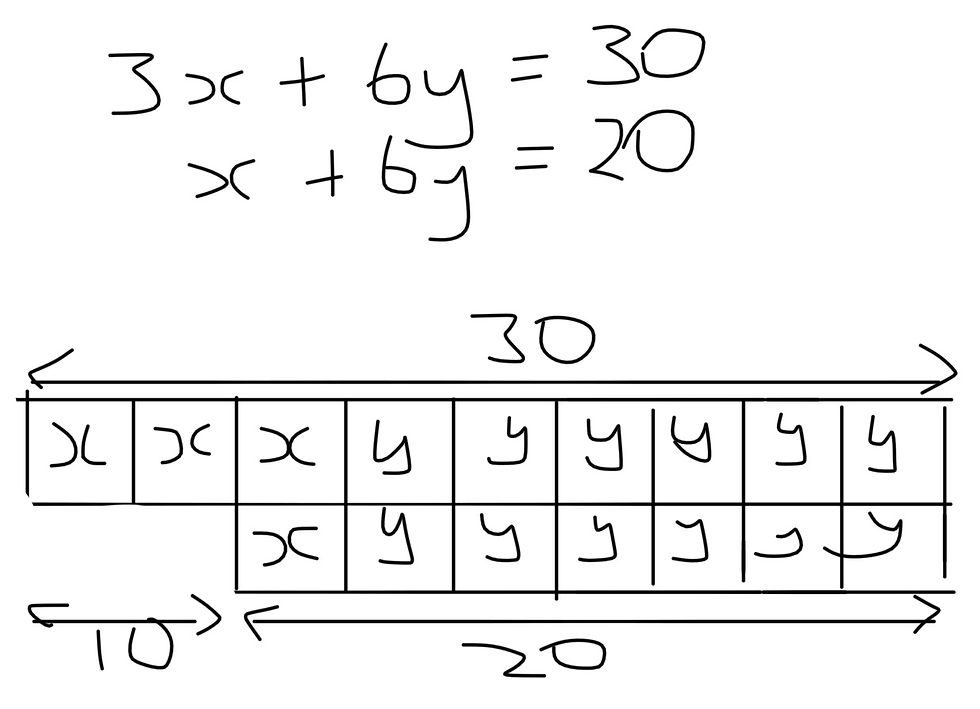
Most of the PixiMaths lessons have been adapted to demonstrate examples using the bar model where possible. I’ve emphasised words with my classes that suggest ways of laying out the bar model: ‘difference’ or ‘more’ means a stacked model may be easier, ‘share’ or ‘divide’ means splitting a whole into parts.
The next step for my teaching is to use more manipulatives with all year groups. At the moment I use mini whiteboards and I ask students to attempt to draw an appropriate bar model for a question, in a separate step to solving it. I want to use strips of paper (or ribbons), Cuisenaire rods and multilink cubes next to take the bar model further and closer towards a concrete method.

Kaiser OTC benefits provide members with discounts on over-the-counter medications, vitamins, and health essentials, promoting better health management and cost-effective wellness solutions.
Obituaries near me help you find recent death notices, providing information about funeral services, memorials, and tributes for loved ones in your area.
is traveluro legit? Many users have had mixed experiences with the platform, so it's important to read reviews and verify deals before booking.